Solutions
For CRO teams
Find what to test next, see what every change did, and know what a click on each element is worth.
Heatmaps on every version of the page
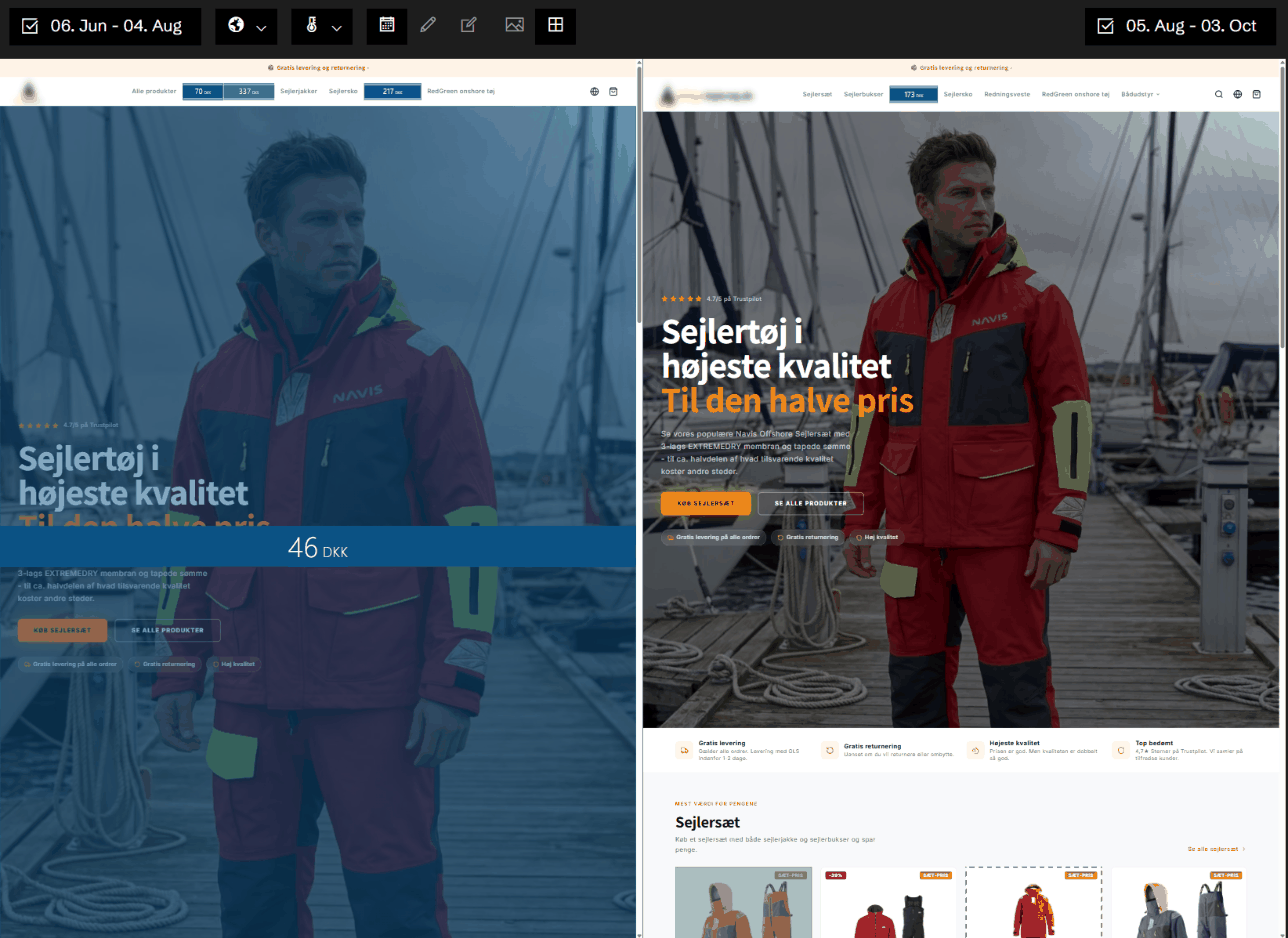
Historian keeps every version of your pages, so the heatmap is drawn on the page as it looked on the day, not on today's page. Compare two versions side by side, and see what moved.
Colour the page by clicks, conversion or revenue per click, and click any element to see its revenue, clicks and converted clicks day by day, the products bought after the click, and where visitors went next.
Templates, devices and traffic
Look at one template across all its pages to find the element that underperforms everywhere. Split the heatmap by device and by traffic source, because a mobile visitor from a paid campaign is not a desktop visitor from your newsletter.
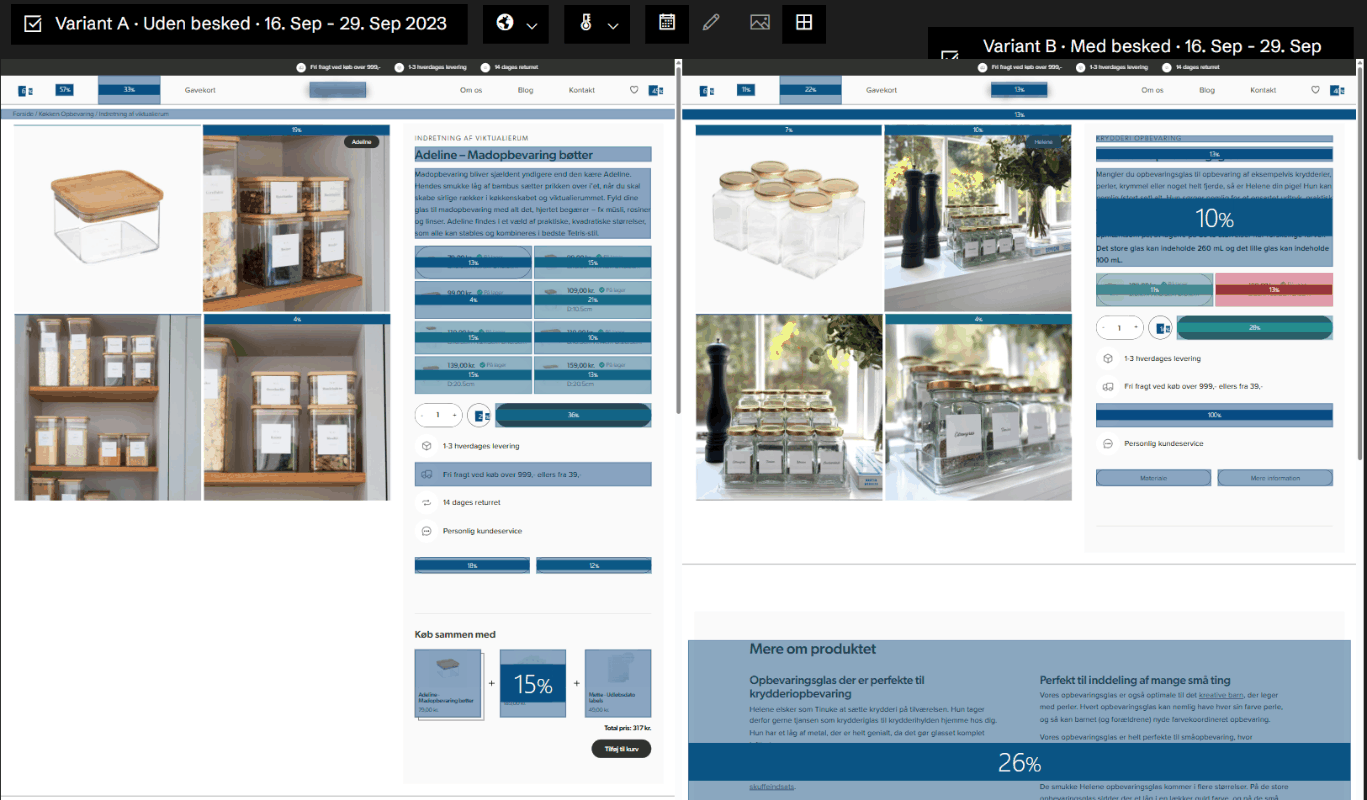
Experiments with a heatmap per variant
Connect GrowthBook, and Historian captures every variant of your experiments and draws a heatmap for each, side by side, next to GrowthBook's own results. You see not just which variant won, but what visitors did differently.
A backlog the agents keep full
The A/B Test Opportunity Finder ranks what to test next by revenue at stake. The CTA Optimisation Advisor, the Mobile UX Gap Agent and the Template-Wide Fix Advisor find the specific elements and templates worth your next sprint.
Related agents
All agents →A/B Test Opportunity Finder
Identifies the elements most worth testing with expected uplift estimates
CTA Optimisation Advisor
Surfaces every underperforming call-to-action with a concrete improvement brief
Mobile UX Gap Agent
Finds every UX element that works on desktop but fails on mobile
Template-Wide Fix Advisor
Identifies issues affecting entire page types — one fix, hundreds of pages improved
Funnel Health Advisor
Detects when a funnel step breaks and connects it to what changed
Product Page Conversion Booster
Finds high-traffic product pages quietly leaking revenue
Related features
All features →Heatmap
The most capable heatmaps in e-commerce. Every click is tied to the element that was clicked, the version of the page it was on, and the conversions, revenue and products that followed.
Revenue per click
Colour the page by what a click on each element brings in, not by how often it is clicked.
Version comparison
Put two periods or two versions of a page side by side, each with its own heatmap and its own numbers.
Template heatmaps
Add up the same element across every page built from one template, and see where it works and where it doesn't.
Experiment heatmaps
A heatmap for every variant of your GrowthBook experiments, and two variants side by side.
Funnels
Conversion at each step of your key journeys, from the first page to the order, with where visitors drop off.
Stop guessing why revenue dropped.
Book a demo and we'll show you what Historian finds on your own store.