Heatmap
Traffic segments
Filter the heatmap by where the visitors came from, and see how each channel uses the page.
What you see
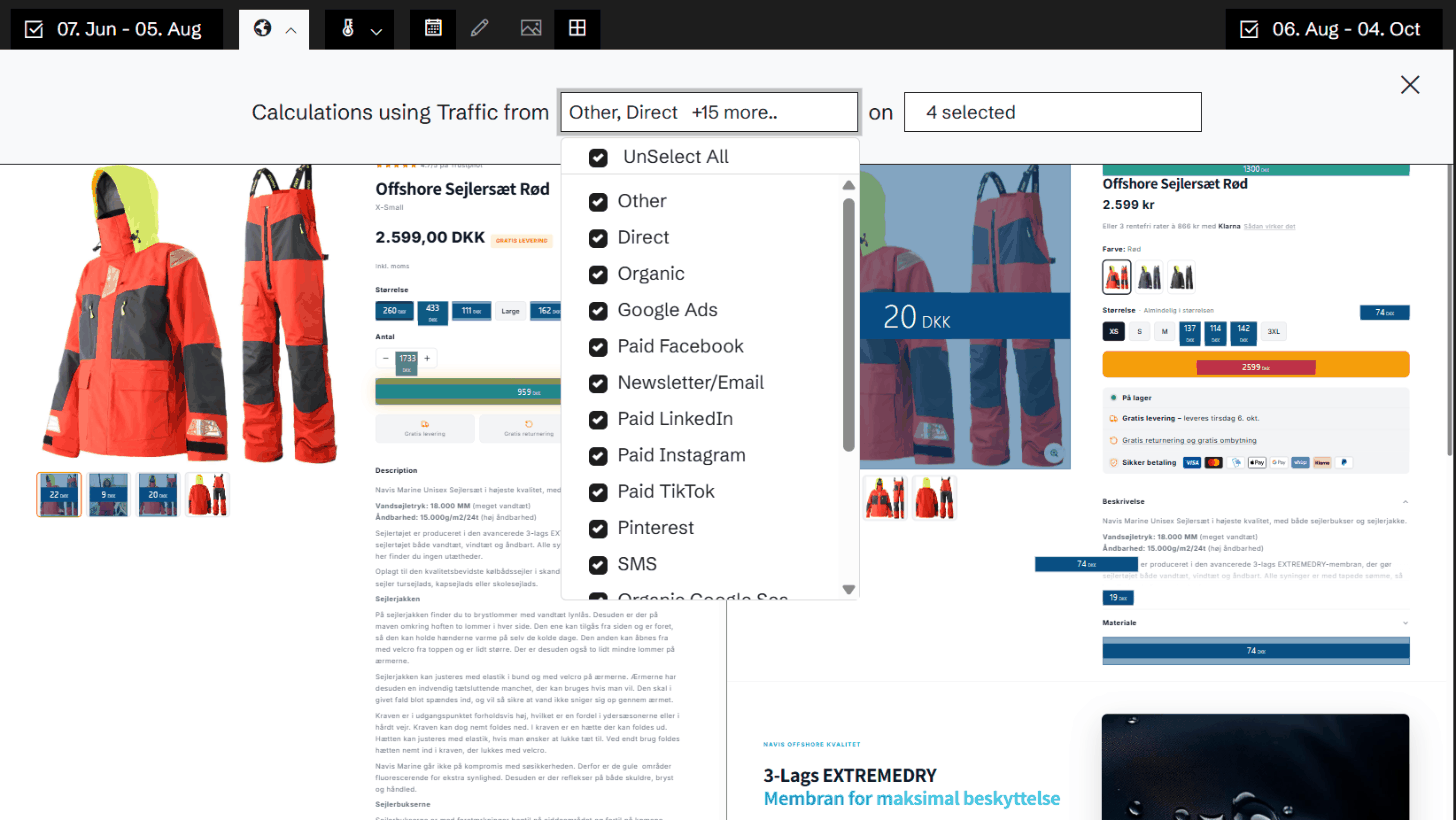
The traffic filter on the heatmap's toolbar: pick one or more traffic types and devices, and the heatmap and the element drill-down are calculated for that traffic only.
The traffic types include direct, organic, organic Google search, Google Ads, newsletter and email, SMS, Pinterest, and paid and organic traffic from Facebook, Instagram and TikTok.
Why it matters
Visitors from a newsletter already know what they came for. Visitors from a Google Ads campaign land cold. They use the same page differently, and a heatmap of all of them together is right for none of them.
An example
Paid social traffic lands on a campaign page and clicks the hero, but rarely gets further. Newsletter traffic skips the hero and goes straight to the product grid, and converts. The same page needs different things for each channel.
More in Heatmap
Heatmap overview →Time Machine
Go back to any version of a page, with the heatmap for exactly that version and a written summary of what changed.
Version comparison
Put two periods or two versions of a page side by side, each with its own heatmap and its own numbers.
Revenue per click
Colour the page by what a click on each element brings in, not by how often it is clicked.
Click products
See which products were bought by the visitors who clicked an element.
Click transitions
See which pages visitors went to after they clicked an element, and what those visits were worth.
Template heatmaps
Add up the same element across every page built from one template, and see where it works and where it doesn't.
Element drill-down
Click any element on the heatmap and follow its numbers day by day, with the days it changed marked on the chart.
Heatmap metrics
Eleven metrics for every element on the page, from clicks to revenue per click. Colour by one and show the numbers of another.
Mobile vs. desktop
See the heatmap for mobile visitors and for desktop visitors, and how the same page works on each.
Experiment heatmaps
A heatmap for every variant of your GrowthBook experiments, and two variants side by side.
Related agents
All agents →Traffic Mix Strategist
Diagnoses over-reliance on any single channel and recommends diversification
Organic Traffic Revenue Maximizer
Closes the conversion gap between organic landing pages and paid equivalents
Landing Page Revenue Gap Agent
Benchmarks every landing page and surfaces the ones dragging down entry conversion
Related features
All features →Mobile vs. desktop
See the heatmap for mobile visitors and for desktop visitors, and how the same page works on each.
Traffic Sources
See which channels actually make money, not just which ones send traffic.
Ads
Your ad campaigns next to what happened on your site: spend, ROAS on your own revenue, and every change made to the campaigns.
Stop guessing why revenue dropped.
Book a demo and we'll show you what Historian finds on your own store.