What Historian sees
Your store's numbers, a daily record of how your pages looked, your ads and your newsletters, and a catalog of AI agents that read all of it for you.
Your numbers, from your own store
A tracking script on your store records sessions, page views, clicks and orders. That is where the numbers in Historian come from: conversion, revenue and orders per page, per product, per device and per traffic source, and revenue per click for every element on a page.
The script is added through Shopify or Google Tag Manager, and it never records what visitors type into a field.
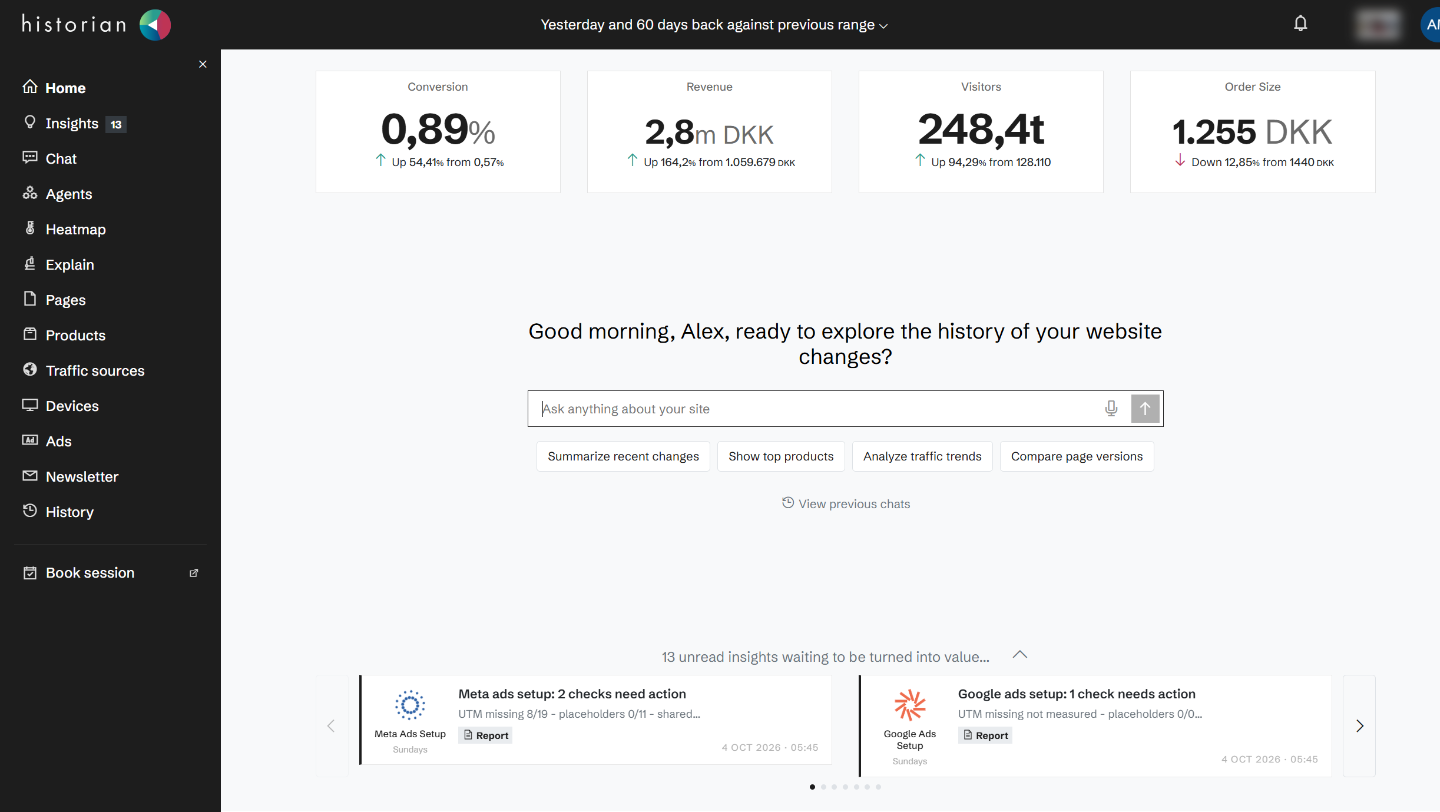
Your pages, as they looked, every day
Chronicle Capture visits your pages every day with a real browser and keeps a full copy of each one: the layout, the copy, the images, the prices and the offers. So you can go back to any day and see the page exactly as your visitors saw it, and Historian can tell you what changed between two days.
Your competitors' front pages are captured the same way, so their campaigns end up next to yours.
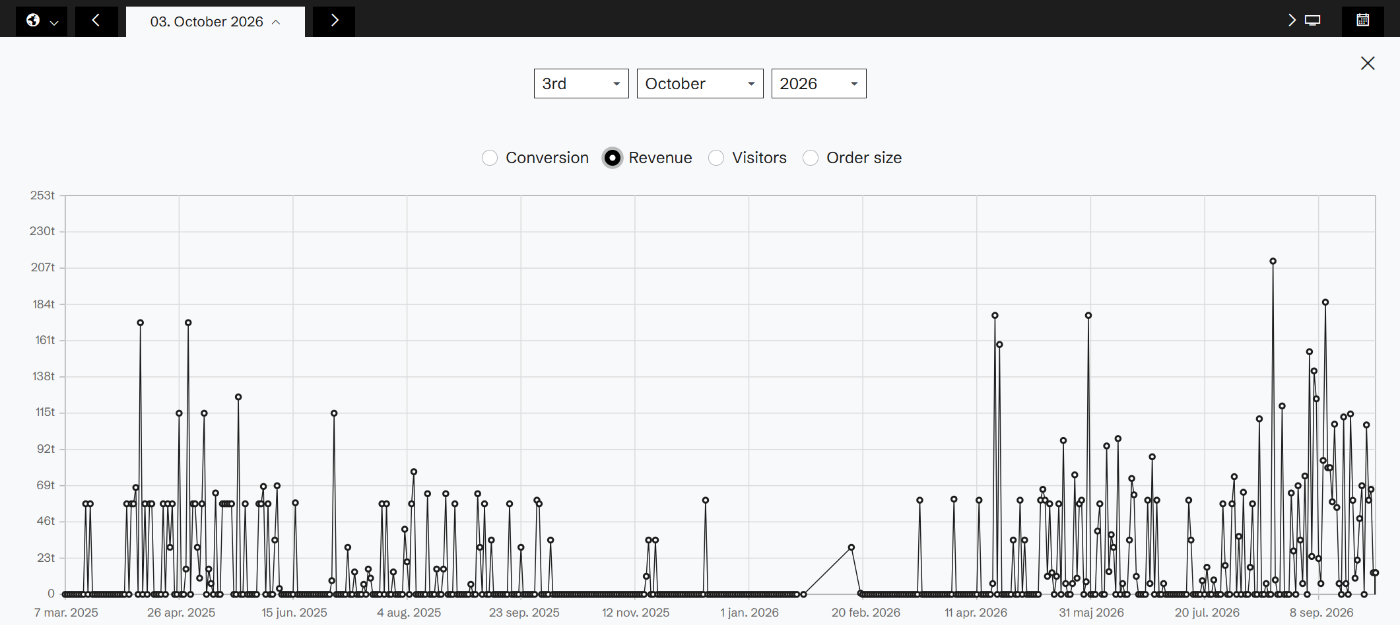
Heatmaps that know what a click is worth
Because every page version is kept, the heatmap is drawn on the page as it looked, not on today's page. Colour it by clicks, conversion or revenue per click, compare two versions side by side, look at a single template across all its pages, or split it by device and traffic source.
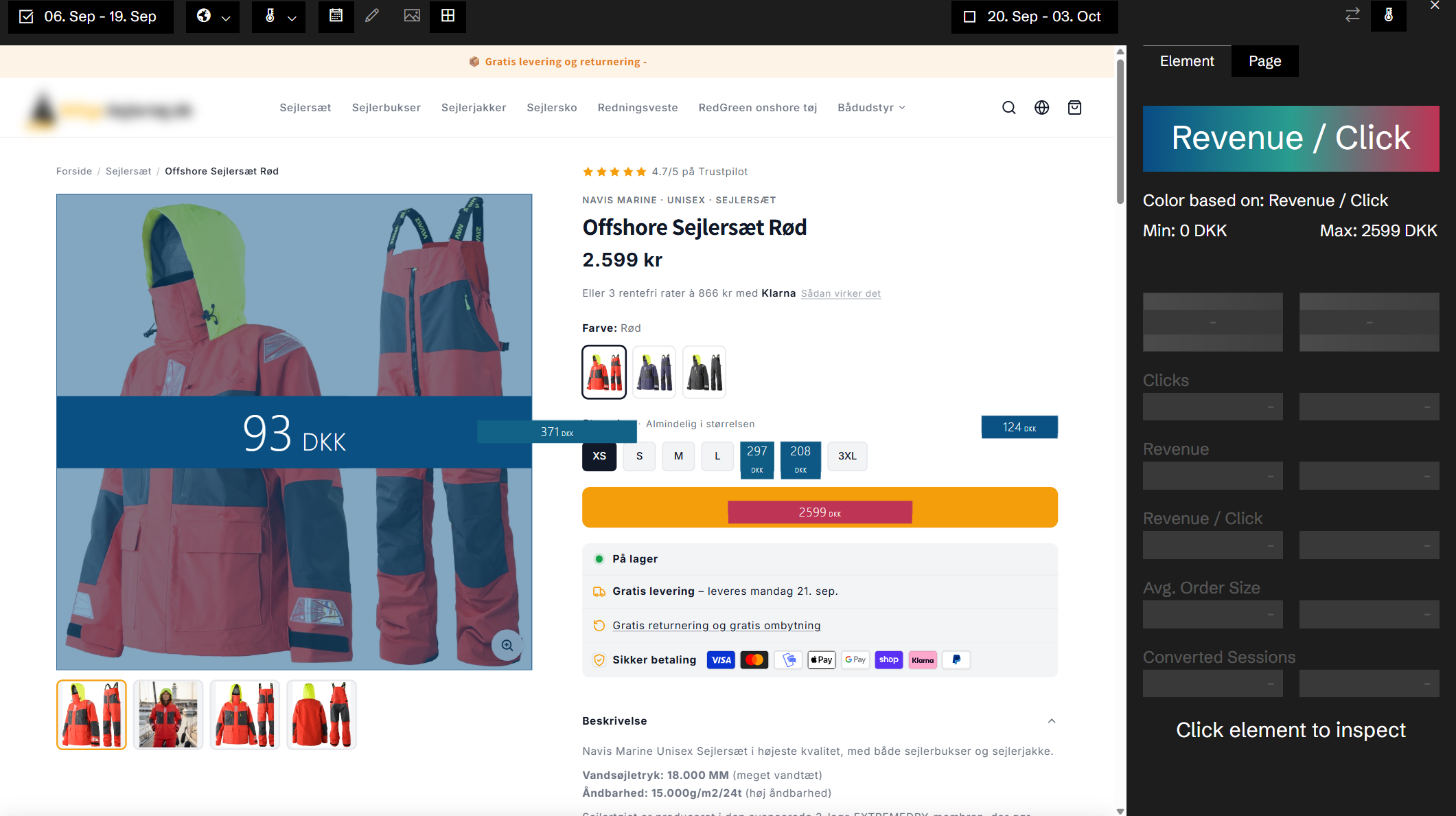
Ads and newsletters, next to the page
Connect Google Ads and Meta Ads, and Historian keeps a daily snapshot of your campaigns: what changed, what it cost, and what happened on the landing page afterwards. And with newsletter analysis, in beta, Historian subscribes to your newsletters and matches each send with the traffic and revenue it brought.
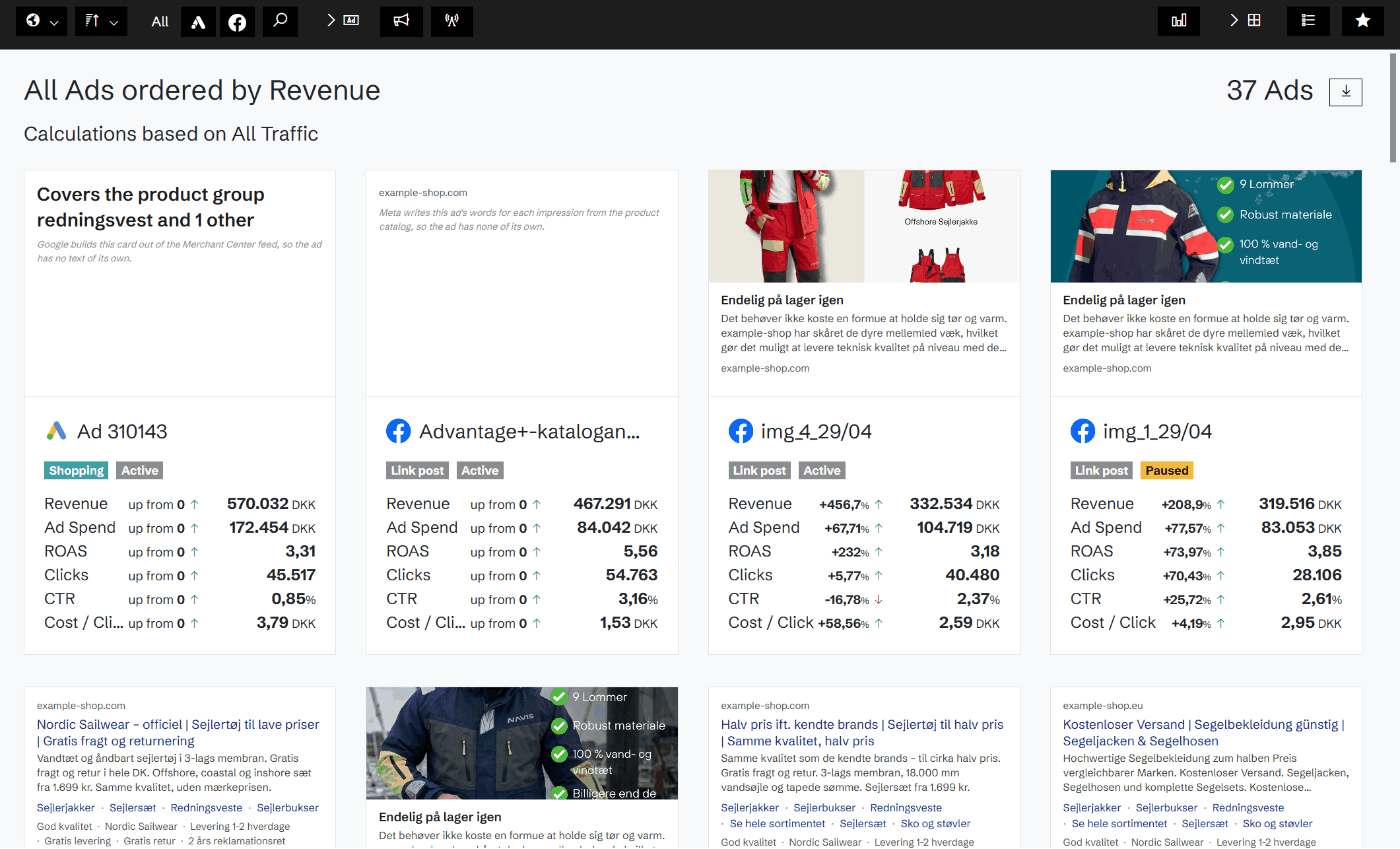
Agents that bring you the findings
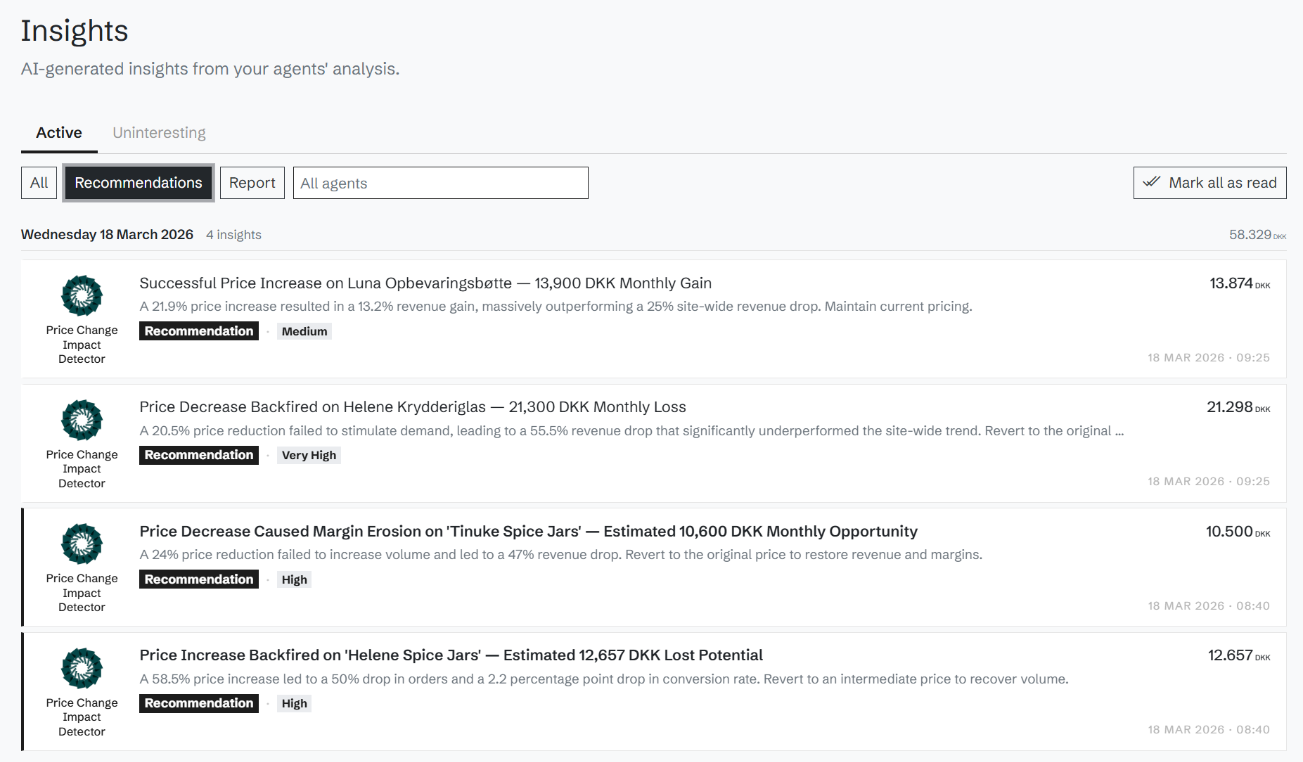
On top of it all sits a catalog of AI agents, each built for one kind of problem: a bad change, a revenue leak, a competitor's campaign, a redesign or a platform migration. They run on a schedule and deliver insights with an estimated revenue impact and the evidence behind them, in the app, by email or in Slack.
Ask a follow-up question on any insight, or ask your own in the analyst chat.
In the app, or in Claude
Everything Historian knows is in the Historian app. With Historian Headless, the same data is available in Claude, next to the other tools you use there. Both are part of Historian.
Related agents
All agents →Bad Change Detector
Detects whether any page changes correlate with performance drops
Weekly Performance Strategist
Your Monday morning briefing — what changed, what matters, what to focus on
Daily Competitor Campaign Monitor
Alerts when competitors make a significant campaign move — silent when they don't
Related features
All features →Chronicle Capture
Every day Historian captures your site as your visitors saw it: the page, its screenshot and every element on it, kept as a record you can go back to.
Heatmap
The most capable heatmaps in e-commerce. Every click is tied to the element that was clicked, the version of the page it was on, and the conversions, revenue and products that followed.
Ads
Your ad campaigns next to what happened on your site: spend, ROAS on your own revenue, and every change made to the campaigns.
AI agents
Agents that watch your site's data on a schedule and bring you insights: pick them from the catalog, or describe your own.
Insights
Every finding from your agents as an insight, with its confidence, its estimated revenue impact and the evidence behind it.
Chat
Ask anything about your site in plain language, and get answers from your own data, with charts and the pages behind them.
Stop guessing why revenue dropped.
Book a demo and we'll show you what Historian finds on your own store.