Heatmap
Time Machine
Go back to any version of a page, with the heatmap for exactly that version and a written summary of what changed.
What you see
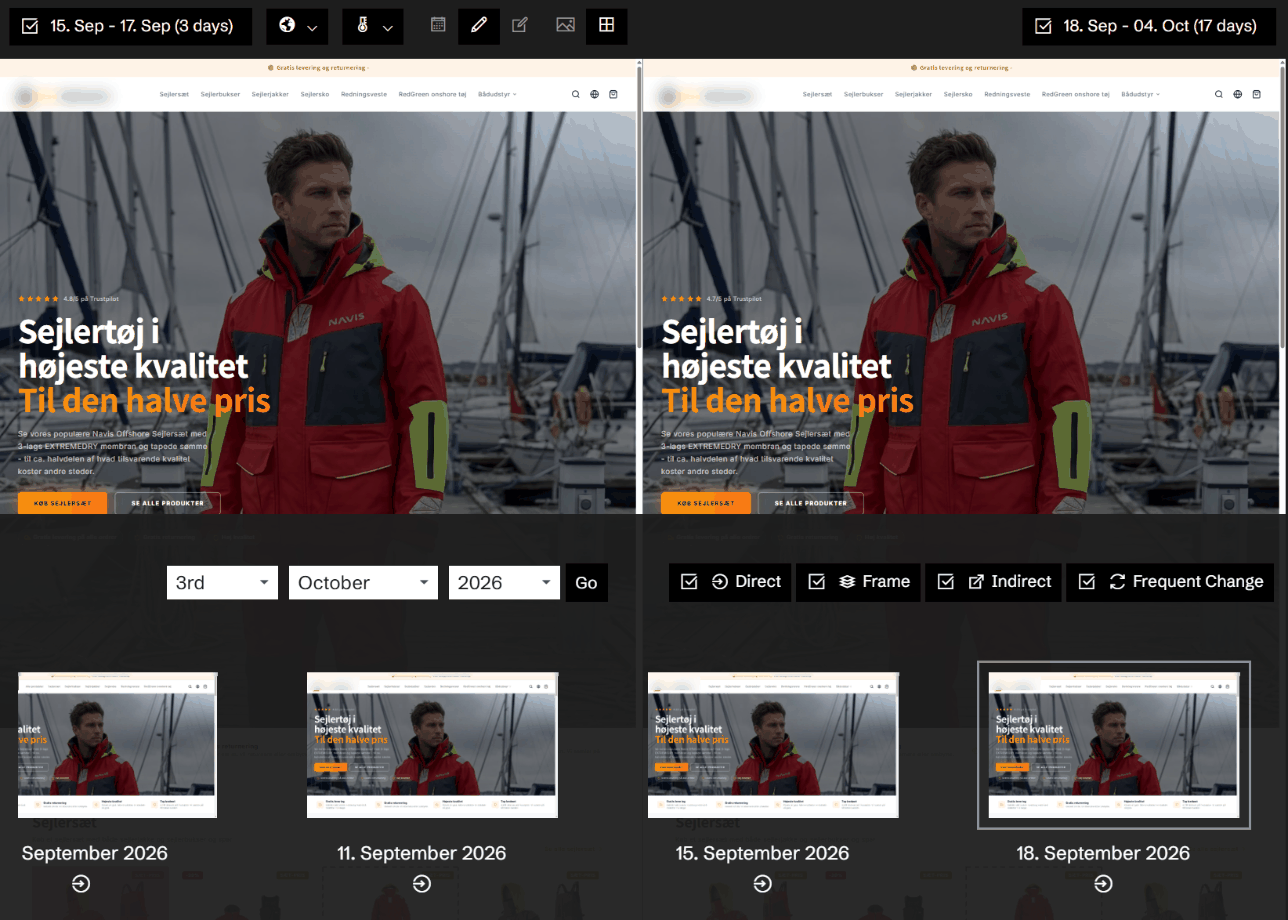
The page as it looked, rendered from Historian's capture, with the heatmap on top. Below it, a strip of every captured version of the page: a thumbnail, the date, and icons for the kind of change it was. Step back and forth with the arrows, or jump straight to a version.
Next to the page, the metrics for the version you are looking at against the one before it: conversion, revenue per visit, order size, revenue, orders, sessions, clicks and CTR, with the change in percent.
Three ways to look back
Date range: pick a period and see the heatmap for it. If the page changed during the period, Historian says so and offers to show each change on its own.
All changes: walk through the page's versions one by one, each with its own heatmap.
Element changes: pick one element and see only the versions in which that element changed.
The change map
Switch from the heatmap to the change map and the changed parts of the page are marked on the page itself. Each change has a written summary of what changed and a level, so you can tell real edits from noise: direct changes to the page's own content, indirect changes caused by another page (such as a product's price), changes to the frame (menu or footer), frequent changes, and dynamic content like timestamps and counters.
Filter by level to see only the changes someone actually made.
An example
Conversion on a category page dropped in March. In the Time Machine you open the page in March, see that the filter bar was moved below the product grid on the 12th, and see on the heatmap that clicks on the filters fell after that version went live. The version before it is one click away, with its own heatmap.
What other heatmaps don't do
Historian keeps the versions of your pages as they change, and stores the clicks per version. You do not have to set up a heatmap for a page in advance, or know which change you will want to look at later: the version and its clicks are already there.
More in Heatmap
Heatmap overview →Version comparison
Put two periods or two versions of a page side by side, each with its own heatmap and its own numbers.
Revenue per click
Colour the page by what a click on each element brings in, not by how often it is clicked.
Click products
See which products were bought by the visitors who clicked an element.
Click transitions
See which pages visitors went to after they clicked an element, and what those visits were worth.
Template heatmaps
Add up the same element across every page built from one template, and see where it works and where it doesn't.
Element drill-down
Click any element on the heatmap and follow its numbers day by day, with the days it changed marked on the chart.
Heatmap metrics
Eleven metrics for every element on the page, from clicks to revenue per click. Colour by one and show the numbers of another.
Mobile vs. desktop
See the heatmap for mobile visitors and for desktop visitors, and how the same page works on each.
Traffic segments
Filter the heatmap by where the visitors came from, and see how each channel uses the page.
Experiment heatmaps
A heatmap for every variant of your GrowthBook experiments, and two variants side by side.
Related agents
All agents →Related features
All features →Version comparison
Put two periods or two versions of a page side by side, each with its own heatmap and its own numbers.
Element drill-down
Click any element on the heatmap and follow its numbers day by day, with the days it changed marked on the chart.
History and change detection
See your site exactly as it looked on any day since Historian started capturing it, with that day's numbers and the events around it.
Chronicle Capture
Every day Historian captures your site as your visitors saw it: the page, its screenshot and every element on it, kept as a record you can go back to.
Stop guessing why revenue dropped.
Book a demo and we'll show you what Historian finds on your own store.