Devices
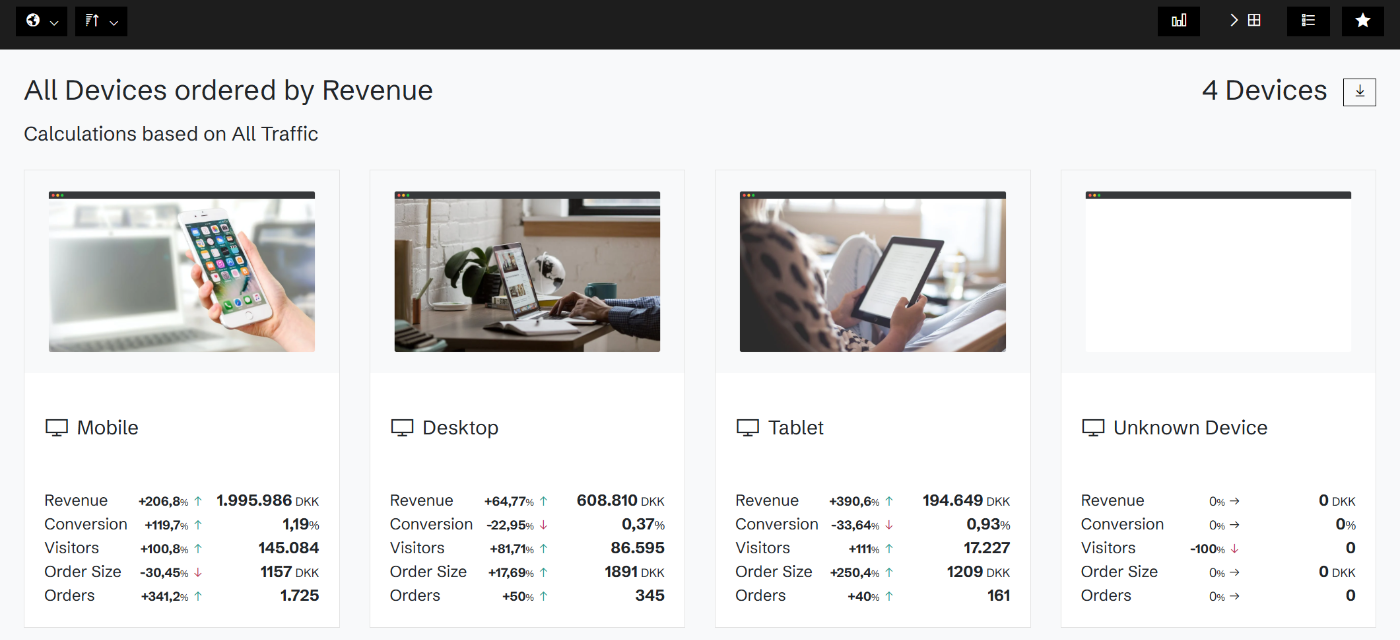
Desktop, mobile and tablet side by side: revenue, conversion and order size for each, against a benchmark.
Side by side
Devices compares desktop, mobile and tablet on revenue, sessions, conversion, order size and orders, each against a benchmark period. A gap between mobile and desktop conversion shows at a glance.
By channel
Filter by traffic source to see how each channel converts on each device, such as paid social on mobile against search on desktop.
See the difference on the page
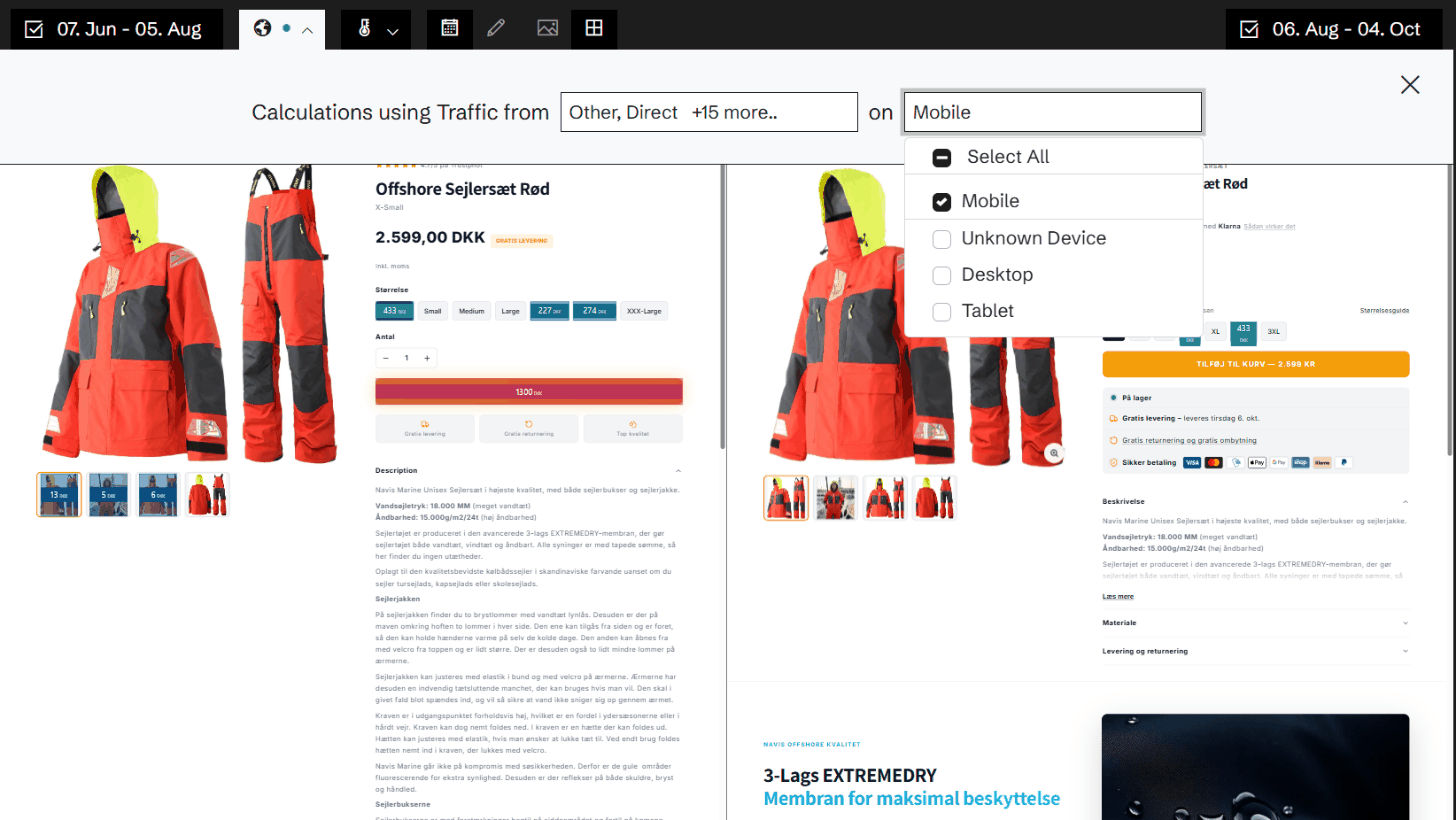
Every page is captured for each device type, and the heatmap switches between mobile and desktop, so you can see why a page converts differently on a phone.
Related features
All features →Mobile vs. desktop
See the heatmap for mobile visitors and for desktop visitors, and how the same page works on each.
Traffic Sources
See which channels actually make money, not just which ones send traffic.
Pages
Every page on your site with its revenue, conversion, visitors and orders against a benchmark, sorted by where the opportunity is biggest.
Stop guessing why revenue dropped.
Book a demo and we'll show you what Historian finds on your own store.