Explain
When a number moves, Explain breaks the movement down by products, traffic sources and devices, so you see what drove it.
What drove the change
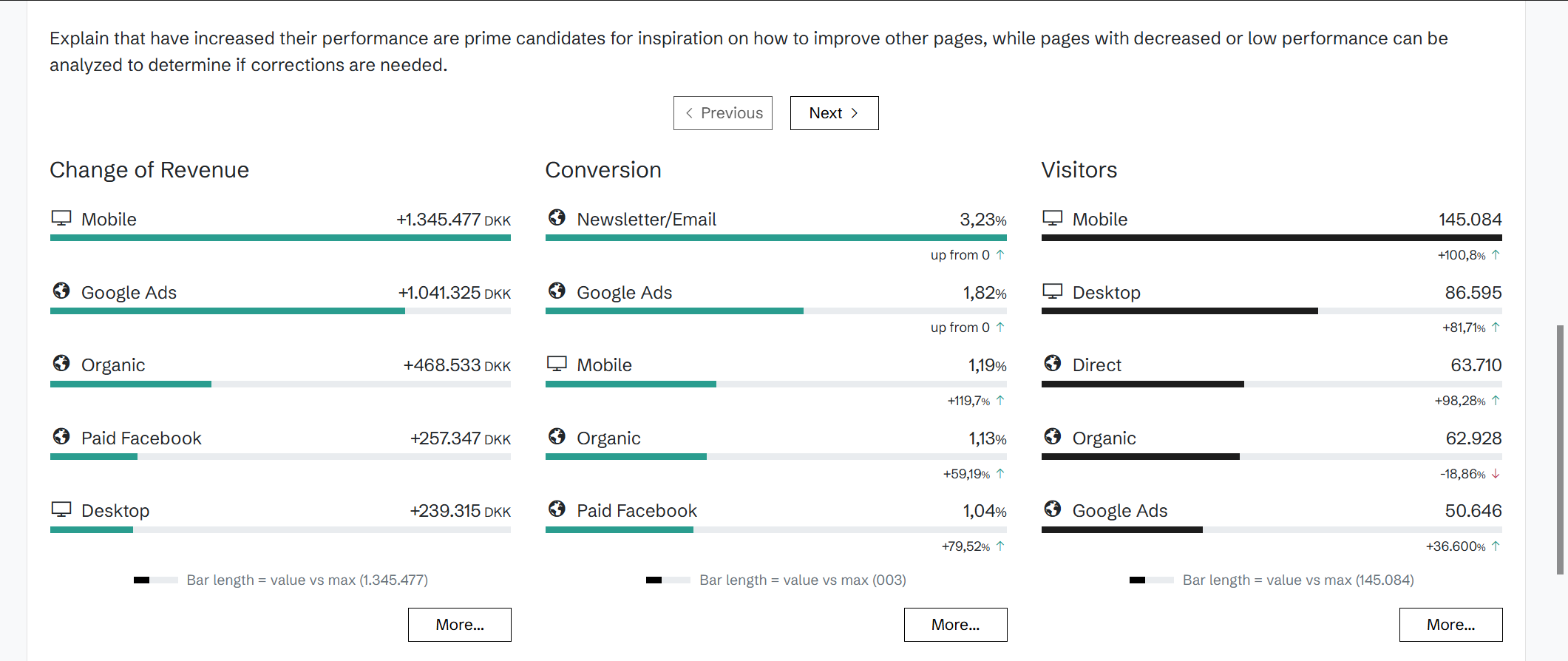
Pick a metric (visitors, conversion, order size or revenue) and a period. Explain compares it with the period before and breaks the change down by products, traffic sources and devices, and by tags when your site uses them.
The result is a waterfall of what pushed the number up and what pulled it down, with the top five contributors in each group.
The impact, calculated
Each contributor's impact is calculated, not guessed. The impact on conversion rate, for example, is the item's conversion rate weighted by its share of sessions, so an item's impact reflects both how much it changed and how much of your traffic it carries.
One item in depth
Open any contributor for its own impact analysis: the current period set against the periods before it, so you can see whether the movement is new or part of a longer trend.
Related agents
All agents →Weekly Performance Strategist
Your Monday morning briefing — what changed, what matters, what to focus on
Revenue Growth Advisor
Ranks the highest-leverage revenue opportunities filtered by what's fixable
Traffic Mix Strategist
Diagnoses over-reliance on any single channel and recommends diversification
Related features
All features →Products
Revenue, quantity sold, visitors and orders for every product, against a benchmark, with each product's price and availability as it was captured.
Traffic Sources
See which channels actually make money, not just which ones send traffic.
Devices
Desktop, mobile and tablet side by side: revenue, conversion and order size for each, against a benchmark.
Tags
Group your pages by what the pages themselves say, such as category, brand or badge, and see the revenue and conversion of each group against a benchmark.
Stop guessing why revenue dropped.
Book a demo and we'll show you what Historian finds on your own store.