Pages
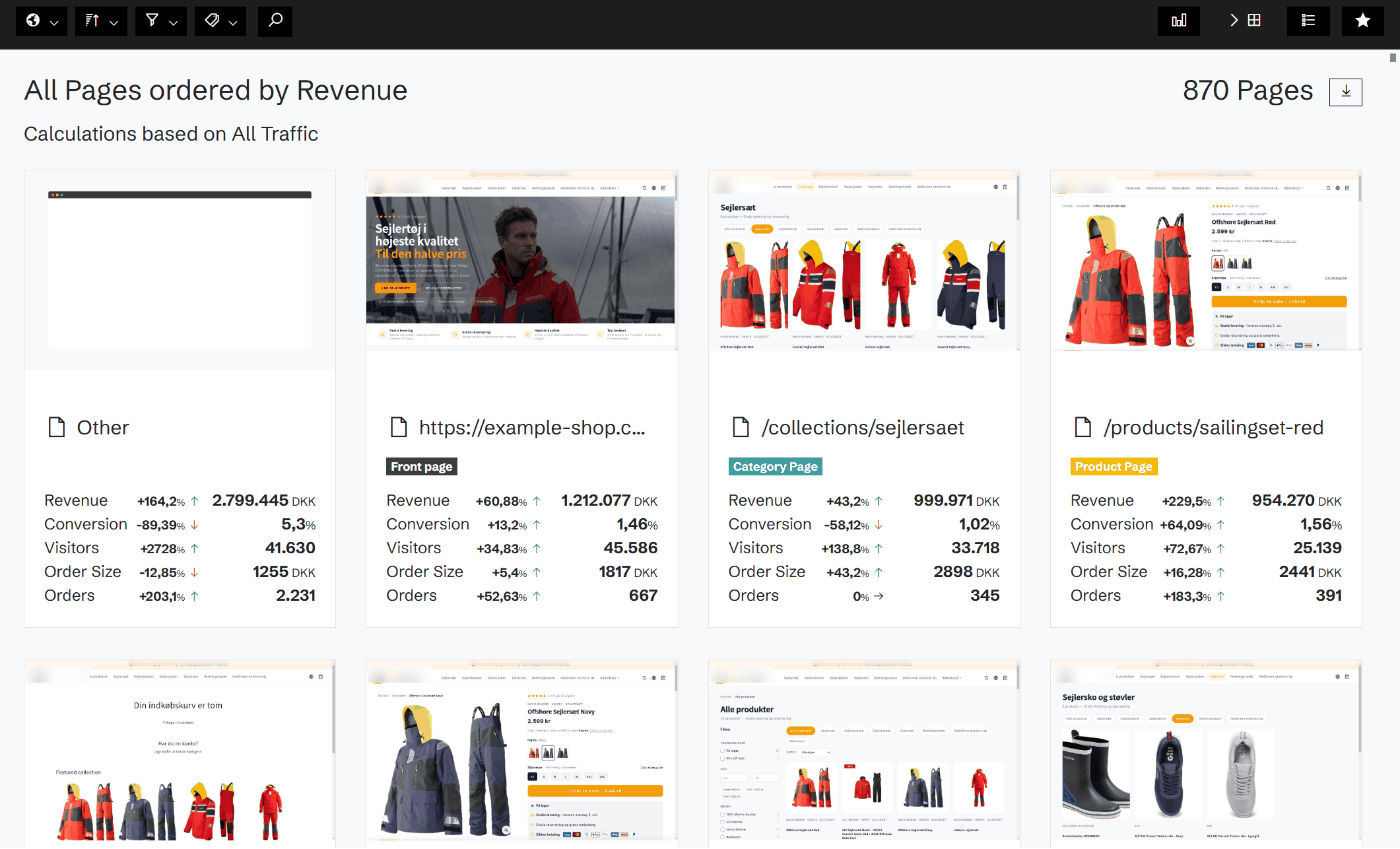
Every page on your site with its revenue, conversion, visitors and orders against a benchmark, sorted by where the opportunity is biggest.
Every page, measured
Pages lists every page on your site with its revenue, conversion, visitors, order size and orders, each against a benchmark period. Show them as a dashboard, as cards or as a table, and keep your favourite pages one click away.
Sorted by opportunity and impact
Sort by any metric, by how much it changed, or by opportunity: what a page would earn if its conversion rate rose to your average, rose by one point, or if one in ten abandoned carts converted. Or sort by impact: how much each page moved your site's conversion rate, order size, revenue or visitors.
Filter to the pages that count
Narrow the list by template, so you see all product pages or all category pages at once, by tag, or by a minimum of revenue, visitors or orders. Search by URL. Every number can be limited to chosen traffic sources and devices.
From the number to the page
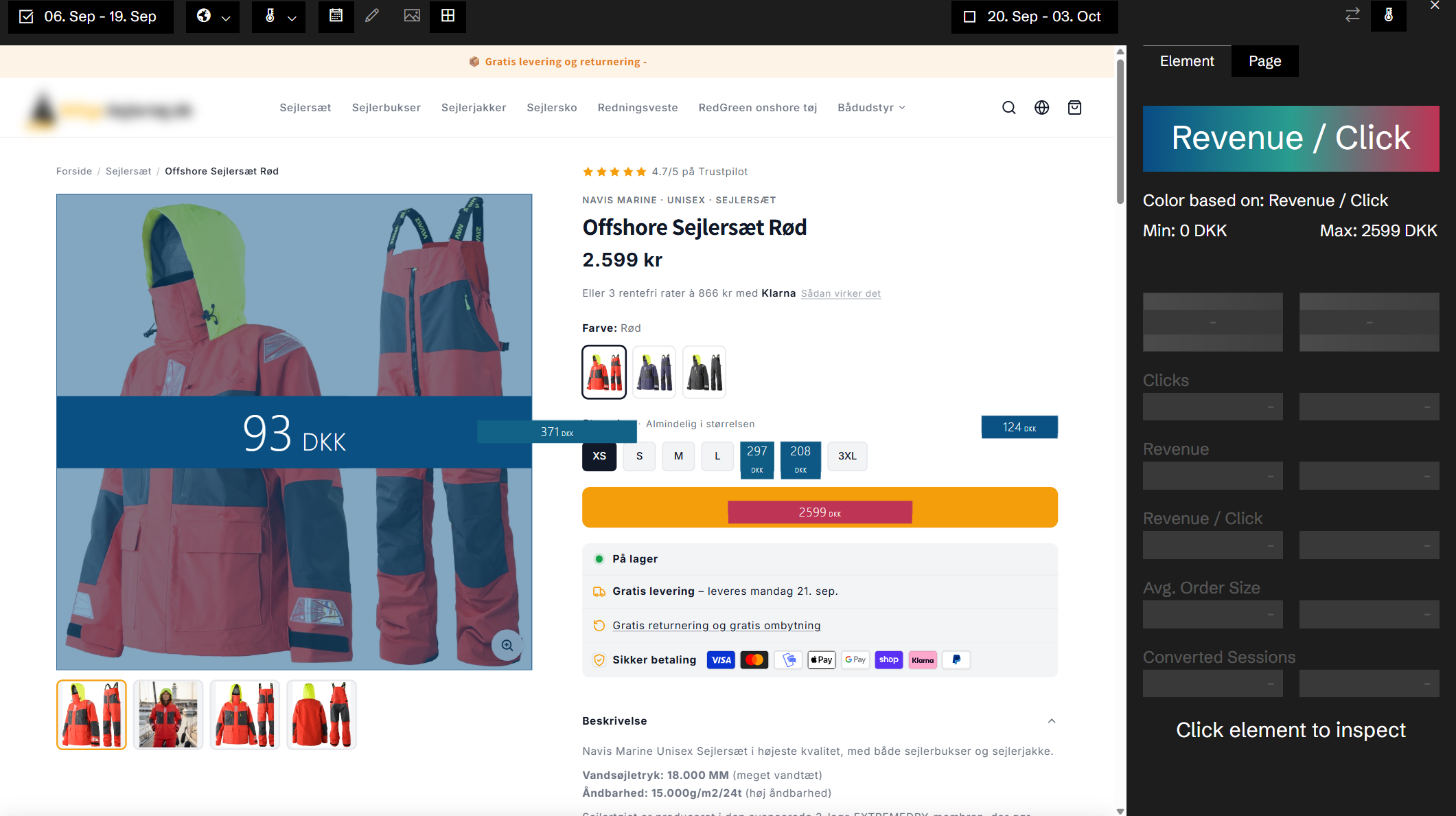
Click a page and analyze it: the page opens in the heatmap and the Time Machine, as it looked in the period, with the changes made to it and where its visitors came from and went next.
Related agents
All agents →High-Traffic Revenue Leaker
Identifies popular pages that attract traffic but fail to monetise it
Landing Page Revenue Gap Agent
Benchmarks every landing page and surfaces the ones dragging down entry conversion
Template-Wide Fix Advisor
Identifies issues affecting entire page types — one fix, hundreds of pages improved
Related features
All features →Heatmap
The most capable heatmaps in e-commerce. Every click is tied to the element that was clicked, the version of the page it was on, and the conversions, revenue and products that followed.
Page flow
For any page, where visitors came from and where they went next, with the numbers for each.
Template heatmaps
Add up the same element across every page built from one template, and see where it works and where it doesn't.
Tags
Group your pages by what the pages themselves say, such as category, brand or badge, and see the revenue and conversion of each group against a benchmark.
Stop guessing why revenue dropped.
Book a demo and we'll show you what Historian finds on your own store.